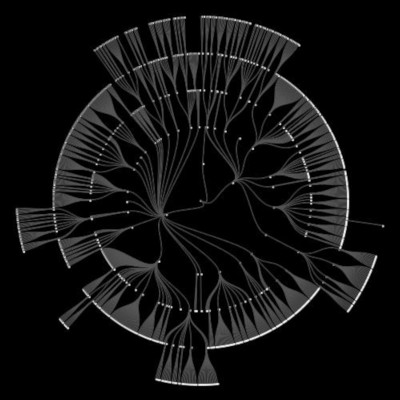
- Organograms
- Design and build of an interactive explorer of UK Government organisational hierarchies.
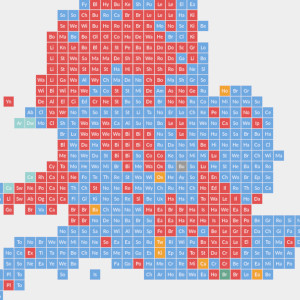
- UK Election Map
- Design and build of an interactive map that presents UK election results.
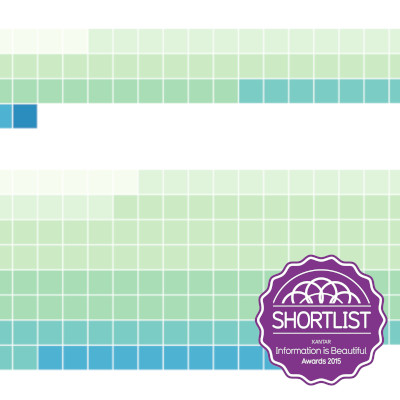
- Survey Explorer
- Design and build of an interactive freelance rates explorer.
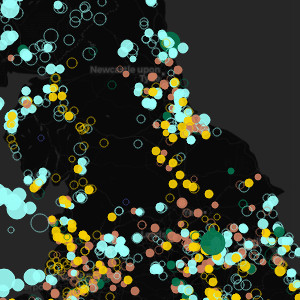
- Renewable Energy Spiral
- Design and build of a spiral timeline showing renewable energy planning applications.
- UK Temperature History
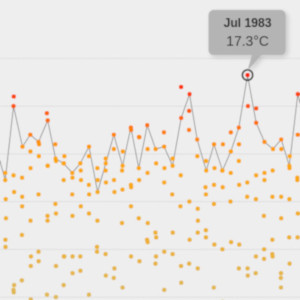
- Design and build of an interactive showing mean temperature across the UK since 1910.
- F1 Timeline
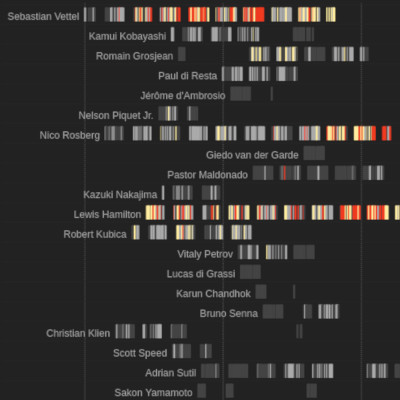
- Design and build of an interactive showing all Formula 1 race results since 1950.
- F1 Greatest Drivers
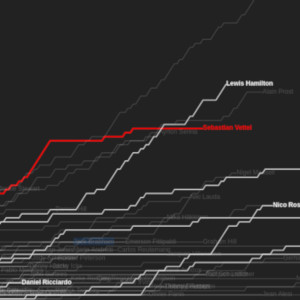
- Line chart showing career trajectory of Formula 1 drivers.
- Brexit Expenses
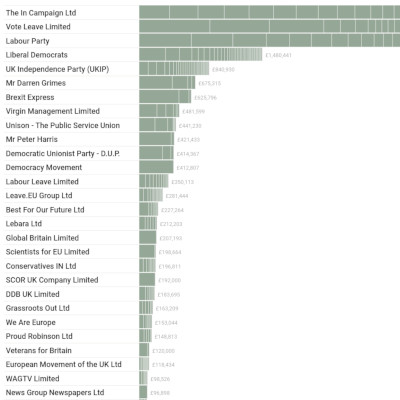
- Design and build of an interactive explorer of the UK's EU Referendum.
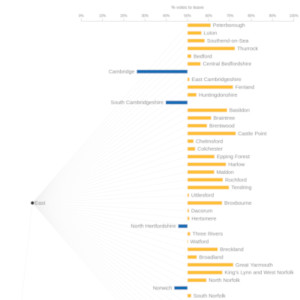
- Referendum Votes
- A hierarchical bar chart showing UK EU Referendum votes broken down by region, county and district.
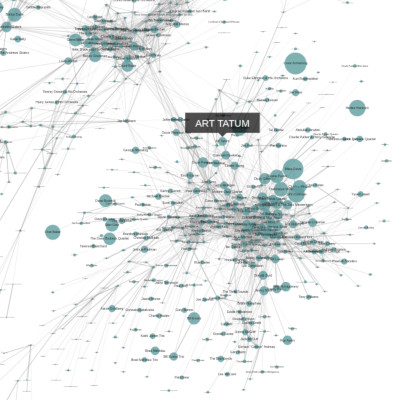
- Who's Like Tatum?
- A network chart showing similarity between jazz musicians.
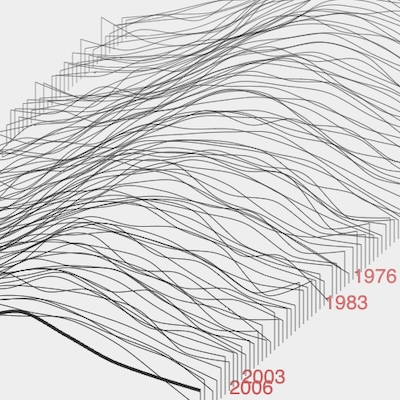
- UK Temperature Lines
- Design and build of a 3d-esque array of temperature line charts.
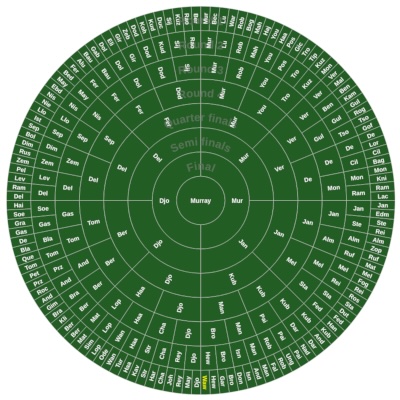
- 10 Wimbledon charts
- Exploratory series of tennis visualisations.
- D3 Tree
- A binary tree built using D3.js.
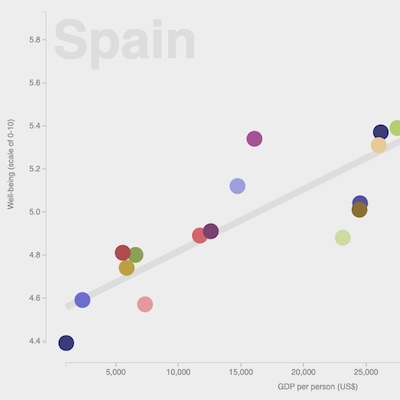
- What Makes Us Happy?
- An interactive scatter plot comparing wellbeing measures, built with D3.js.
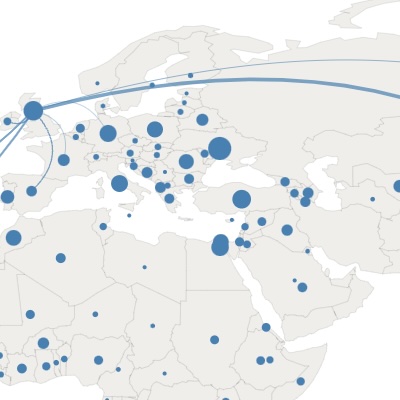
- World Migration
- A world map showing migration patterns, with swoopy arrows.
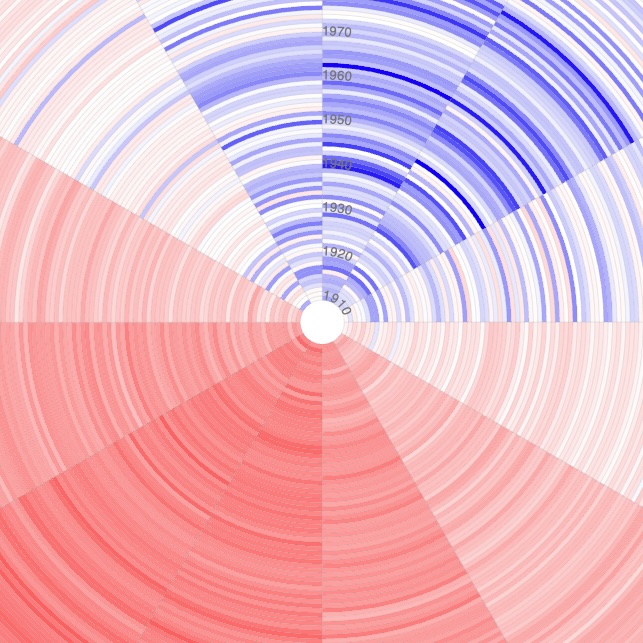
- Circular heatmap of UK temperature
- Design and build of a circular heatmap showing historic UK temperature.
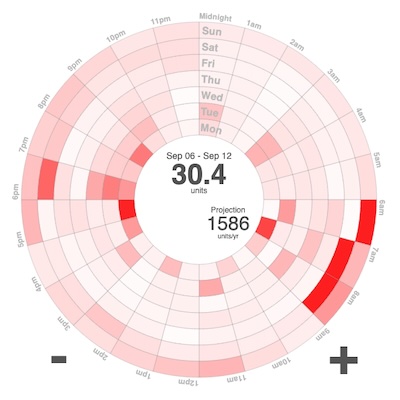
- Circular heatmap of energy consumption
- Design and build of a circular heatmap showing household energy consumption.
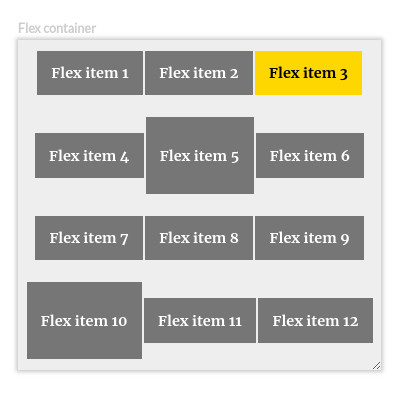
- Flexplorer
- Design and build of an interactive tool to explore and understand the CSS FlexBox model.
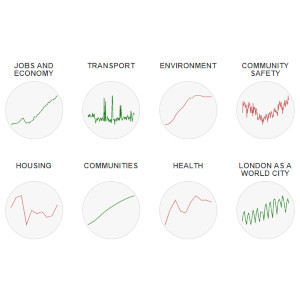
- London Datastore Dashboard
- I built and co-designed the summary dashboard on London Datastore's home page featuring historic at-a-glance indicators. Collaboration with DataPress.
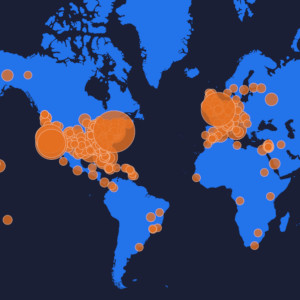
- Celebrity Cruises: Music Mapped
- I built and co-designed an interactive music map for Celebrity Cruises showing the places most mentioned in songs.
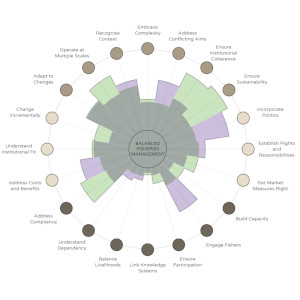
- Coastal Fisheries Success Factors
- Build of an interactive explorer of competing factors in coastal fishing. Collaboration with Threestory Studio.
- IFOAM Organic in Europe Map
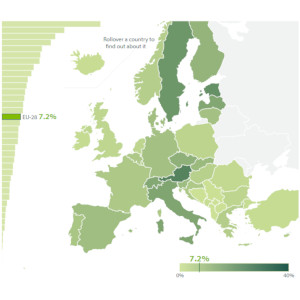
- Build of IFOAM's interactive map of organic processing/production in Europe. Collaboration with Background Stories.
- Close Encounters
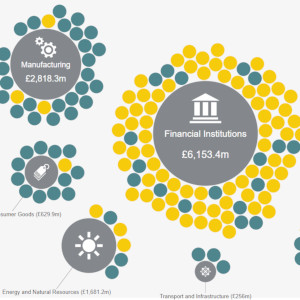
- I built and co-designed this interactive for Womble Bond Dickinson.
- McGraw Hill DataVis components
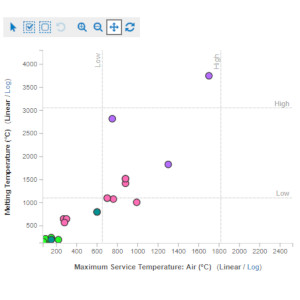
- Build of interactive dot and scatter plots for award winning education tool.
- Heatmap component for Writer's Block
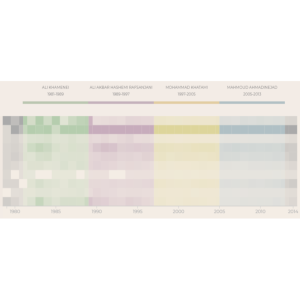
- Build of D3 based interactive, hierarchical heatmap component for Writer's Block by Small Media.
- Expect the Unexpected
- Build of Carbon Tracker's interactive scenario explorer for cost of renewable energy.
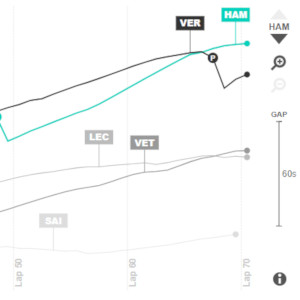
- How the Race Unfolded
- I built and co-designed a lap by lap visual analysis chart component for Motorsport Stats.
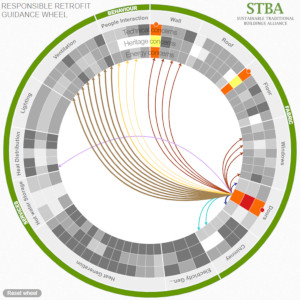
- Responsible Retrofit Guidance Wheel
- Build of STBA's interactive tool for assessing impact and interaction of retrofits in traditional buildings.
- Getting Started with D3.js
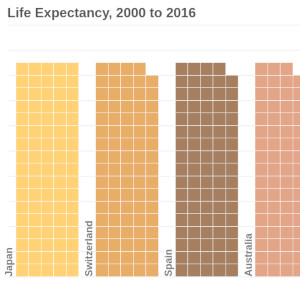
- How to Make an Interactive Map of Geographic Paths
- How to Make a Tiled Bar Chart with D3.js
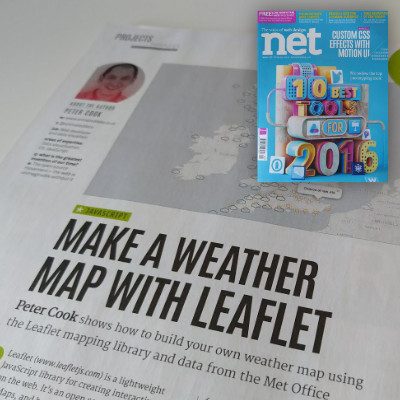
- Make a Weather Map with Leaflet
- Tutorial for net magazine (February 2016).
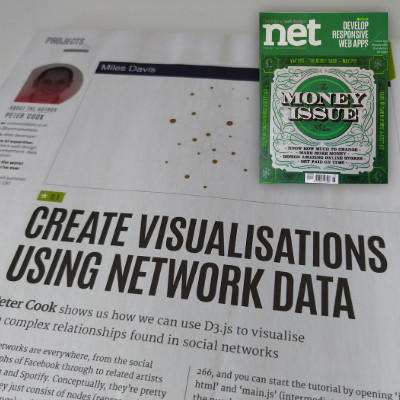
- Create Visualisations using Network Data
- Tutorial for net magazine (May 2015).
